

How to Identify Stock Market Trends: A Step By Step Guide
Stock prices react continuously to the mood in the market, thus causing periods of growth, fall, and consolidation of price levels. Sometimes stocks go up powerfully. At other times, sellers get control over the price action. Occasionally, the market consolidates without any visible trend. Understanding the dynamics of changing price actions is a fundamental element of market analysis.
Here comes the role of trends in the stock market.
A trend provides traders and investors with a broader perspective on how the prices behave in a certain period of time. Rather than trying to analyze one single candle or daily price movement, a trend analysis focuses on the general price structure and tells us whether the market goes up, down, or consolidates.
The study of market trends makes the technical analysis easier for beginners. In this guide, we will learn about various types of trends, how to detect them, what tools could be used for that, the way they change, and mistakes beginners should avoid.
What are the Stock Market Trends?
The term ‘stock market trends’ means the direction of movement of the price of stocks, indices, or other securities over a certain period of time.
The formation of a trend may occur at various time intervals. A stock may be in uptrend on a daily chart but may have experienced a drop on a 15-min chart.
In general, there are three main kinds of stock market trends:
• Uptrend
• Downtrend
• Range-bound trend
These three situations form the basis of stock market trends.
Main Types of Stock Market Trends You Should Know
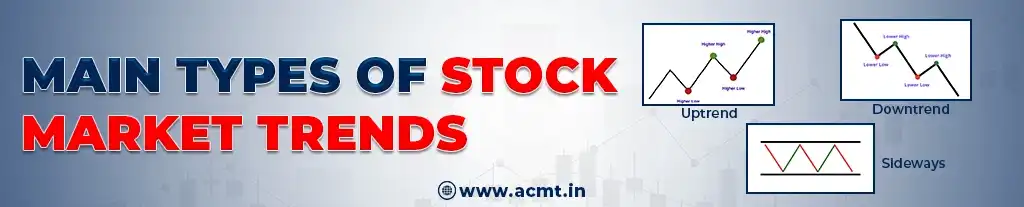
1. Uptrend: When the Buyers Take Control
The uptrend arises when the price rises gradually to form higher highs and higher lows.
For instance:
₹100 → ₹110 → ₹105 → ₹118 → ₹112 → ₹125
In this case, the price is forming higher peaks as well as the downward movement remains higher than the previous low.
Such kind of market trends reflects that buyers have higher participation in that period.
But this does not necessarily imply that there will be a continuous rise in the prices.
2. Downtrend: Where There Is an Accumulation of Selling Pressure
When sellers make attempts to take prices to lower levels and buyers fail to move back to the previous highs, a downtrend takes shape. On the graph, such a pattern can be identified by the presence of a series of lower highs and lower lows.
For instance:
₹125 → ₹115 → ₹121 → ₹108 → ₹114 → ₹100
It is evident from above that the bounces do not exceed the previous high while the lows keep falling. This indicates the presence of some selling pressure affecting the price movement.
To a person analyzing the trend in the stock market, it helps to recognize such a structure, since it becomes easier for him to get a clear idea of the deteriorating price behavior.
3. Sideways Trend: When Prices Stay within a Certain Price Range
Sometimes, the balance between buyers and sellers will be such that the price does not form any kind of clear upward or downward trend. Instead, it will keep fluctuating between two price levels that are significant.
This situation is often referred to as a sideways trend or range-bound market.
To give an example, let us consider a stock which repeatedly attracts buying at ₹100 and selling at ₹110:
₹100 → ₹108 → ₹102 → ₹109 → ₹101 → ₹107
In other words, the price will be consistently fluctuating within the same wide range without forming any definite series of higher highs or lower lows. Recognition of this stage is a very important aspect of trend analysis in the stock market since a range-bound market operates differently from a strongly trending market.
Importance of Understanding Market Trends
It’s easy to assume that when a stock increases by 3%, in a day, then the stock must have started a bullish trend.
However, the reality might be that the stock had been declining for some weeks.
A bigger picture of the chart will give you an idea if the move was a part of the trend or just another short-term move.
Stock market trend analysis will enable you to:
• Know the overall trend of the market
• Comprehend the nature of prices
• Analyze any possible trade setups
• Find key levels of support and resistance
• Not depend on one candle
• Move from one timeframe to another
• Utilize the technical indicators better
• Build your systematic trading approach
Learning a trend will not allow you to know every future move of prices. It will only enable you to understand what the market is currently doing.
Identifying Stock Market Trends from the Chart

There is no need for complex techniques for understanding stock market trends. The first step is to analyze the price action after every significant up and down. The connection between previous highs and lows can show who controls the price – buyers or sellers.
Check for Higher Prices
An uptrend is characterized by regular ability of buyers to bring the price above the previous high point. In the case of a retracement, the drop usually finds support at the level above the previous low. This can be seen as an indication of the presence of buying power behind the market trend.
Example:
₹24,000 → ₹24,300 → ₹24,150 → ₹24,500
In this example, the price reaches a new high and the retracement stays above the previous starting point. The following movement towards a higher price makes the belief in buyers’ dominance even stronger.
Check for Lower Prices
The downtrend is represented by the opposite pattern. Sellers move price to the new lows while any rebound does not reach the previous high. If the next down move takes place below the previous low, then the bearish pattern becomes more clear.
Price Action: One of the Simplest Ways to Analyze Trends
Price action refers to analyzing the behavior of prices on charts.
Rather than applying several indicators from the start, one can first look at:
• Whether there are higher highs?
• Whether there are higher lows?
• Whether there are lower highs and lows?
• Whether there is a specific range respected by price?
• Whether the support levels are holding?
• Whether the resistance levels are being broken?
Price action makes stock market trend analysis in stock market easier. Price action may assist in judging whether the move is weak, strong, or just a retracement.
Moving Averages and Stock Market Trends
Moving averages are some of the most widely used tools in technical analysis.
Moving averages smooth out price action to form a trendline that may help to see the bigger picture more clearly.
Here are some moving averages that are frequently used:
• 20-period moving average
• 50-period moving average
• 100-period moving average
• 200-period moving average
For instance, if a moving average is up and the price holds above it, it may serve as an additional sign of strength.
In case when the moving average is down and the price stays below it, it may be a sign of a weak market environment.
Support and Resistance: Important Levels for Stock Market Trends
Support and Resistance – Levels That Influence Stock Trends
Support and resistance may be helpful when analyzing trends in the stock market.
Support –
Support is the place where buying activity was observed before and where price could not fall further.
Resistance –
Resistance is the place where selling pressure was observed before and where price could not rise any higher.
If there is a stock which always receives bids around ₹1,000 and cannot rise above ₹1,100, then:
• ₹1,000 would become a support level,
• ₹1,100 would become a resistance level.
The breakout or the breakdown through resistance or support levels respectively would shift traders’ views on the prevailing trend in the market.
It should be noted that usually support and resistance levels are zones and not exact points.
Can Technical Indicators Help Identify Stock Market Trends?
Yes. Technical indicators will add more information when studying trends in the stock market.
Some of the popular indicators are:
RSI –
RSI stands for Relative Strength Index, which is used to study price momentum.
This indicator can help traders know whether buying and selling pressures are getting stronger or weaker.
MACD –
MACD is used to study momentum and potential changes in trend behavior.
ADX –
ADX is used to study trend strength.
Moving Averages –
These indicators can help traders study the overall direction of price movement.
The trick is not to use all indicators out there.
Sometimes a simple chart with knowledge of price structure is more useful than a chart loaded with technical indicators.
Steps for Verifying a Stock Market Trend before Placing a Trade

Recognizing a potential trend is just the initial step.
To make a trading decision, one could use several aspects to confirm the trend.
1. Look at the Price Pattern
Check if the price pattern is as follows:
• Higher highs and higher lows
• Lower highs and lower lows
• A range
2. Consider the Volume
The volume can bring more insights into participants’ actions regarding some price action.
Highly significant moves with high volume might offer more context as compared to low volume moves.
3. Consider the Key Levels
Take into consideration support, resistance, previous highs, previous lows and key price levels.
4. Analyze Several Timeframes
Short term trends may be quite different from long term trends.
For instance:
• Daily timeframe – for a broader trend
• 1-hour timeframe – for a medium term trend
• 15-minutes timeframe – for a short term movement.
How to Recognize a Trend Reversal?
Every trend cannot exist endlessly.
An uptrend may become weak and ultimately result in a downtrend. Likewise, the downtrend may lose its selling pressure and start showing signs of recovery.
This phenomenon is called the trend reversal.
Some of the indicators that might be considered by traders are:
• Failed to make a new high
• Lower high formation
• Breaching an important support level
• Lower lows formation
• Very strong shift in price action
• Volume changes
• Breaching a long-held trading range
Pullback and Trend Reversal
It is important for the beginner trader to differentiate between these two.
Let us assume that the stock is in an uptrend and it falls temporarily from ₹500 to ₹470 and then starts rising again.
This might be just a pullback.
The reversal is quite different in terms of changing the market structure.
Hence, a reversal cannot always be expected after a fall in an uptrend.
Factors Leading to Market Trend Reversals
Stock market trends may reverse due to various reasons.
A few of those are:
• News about companies
• Economic statistics
• Monetary policy decisions
• Trends in global markets
• Governmental decisions
• Political factors
• Investor psychology
• Surprises
For instance, an upward-moving stock may suddenly have a significant price fall if it receives some negative surprises.
This is the reason why traders must keep on analyzing market trends rather than relying on the continuation of the same trend.
Common Mistakes Beginner Makes While Analyzing Market Trends

1. Watching a Single Candle
A single big green or red candle doesn’t make a trend.
The bigger picture regarding prices should always be considered.
2. Using Too Many Indicators
Using too many indicators causes confusion.
Begin with simple technical analysis and price action and add indicators later on.
3. Not Paying Attention to the Time Frame
There could be different trends of a stock in different time frames.
It is important to know if a trend is for short term or long term.
4. Following a Strong Move in Price
When there is a sudden increase in the price of a stock, a beginner will try to trade because he is afraid of missing out.
He should first analyze and calculate his risks before trading.
5. Assuming All Breakouts Are Legitimate
Sometimes there could be false breakouts in the market.
Just because a price breaks above the resistance for some time doesn’t mean an uptrend has been formed.
6. Not Managing Risks
Good stock market trend analysis cannot assure the results of a trade.
It means that the rise of the price over the resistance will not be enough evidence to consider a new uptrend.
Simple Guide to Analyze Stock Market Trend for Beginners

If you are new to technical analysis through charts, you may use the following process to make your own decisions.
Step 1: Begin with the Big Picture
Open a larger timeframe chart and analyze its direction.
Step 2: Identify the Highs and the Lows
Find higher high and higher low, as well as lower high and lower low.
Step 3: Identify Support and Resistance Levels
Mark the key price levels that have been tested by the market before.
Step 4: Identify the Moving Average
Consider using an appropriate moving average indicator.
Step 5: Consider Momentum
Use RSI or any other appropriate indicator for analyzing the price momentum.
Step 6: Seek Confirmation
Do not rely on just one signal. Compare the price structures, levels, volume and indicators.
Step 7: Manage Your Risk
Before you decide to enter into the trade, be aware of when your analysis will be invalid and consider your risk management strategy.
Are Stock Market Trends Helpful in Intraday Trading?
Yes, studying the stock market trends may also be relevant to intraday trading.
Intraday traders are expected to understand both the overall market trend and the shorter term price action.
For instance, an intraday trader may:
1. Analyze the overall NIFTY trend.
2. Detect key levels of support and resistance.
3. Analyze the prevailing price action.
4. Shift to a lower time frame.
5. Identify a good setup.
6. Determine risks before entering the trade.
This technique can give better perspective than just responding to all short term price movements.
Conclusion
While the stock market appears to be full of uncertainty, the price tends to provide useful hints to those who understand where to find them. The analysis of the stock market trends helps you stop guessing and learn how to read the market properly. Combining price, market structure, support/resistance, moving average, volume and technical indicators will allow you to gain a better understanding of the market movement.
Please remember that stock market trend analysis is aimed at identifying whether the trend is bullish or bearish, but not at prediction of its every step forward or backward. It should help you identify the trend, understand its strength or weakening, recognize any potential reversal and manage risks efficiently.
Therefore, the next time you will have a trading chart opened, you should try to ask yourself not just “will the price move up or down?”, but rather “what does the market tell me?”.
About The Author
Arun Gupta is an educationalist in the stock market and trader with a focus on technical analysis, trading techniques, market behavior, and real market education. He tries to simplify the difficult trading concepts to make them easy to learn by both novices and experienced traders.
The fields of interests of Arun Gupta are technical analysis, intraday trading, options trading, demand & supply analysis, and trading view based tools. In case you want to know more about his stock market education, market insights, and other useful information, then you can visit the official website of ACMT or you can follow him on Instagram.
