

7 Key Stock Market Metrics to Check Before Buying a Stock
Now imagine that two investors have purchased the same stock on the same day. Investor number one because he heard from his friend that the stock was “going to the moon.” Investor number two took one hour analyzing the company’s financial statements before making his decision. Five years down the road, who do you think is going to sleep better?
Investing in a stock without analyzing its numbers is similar to purchasing a used car without looking under the hood. It may work just fine, but you are simply taking a gamble.
The positive thing is that you do not need a degree in finance to stop doing that. What you need is several stock market metrics that will help you analyze a business’ health, value, and financial well-being, all of which tell whether or not it is worth your investment. This book covers seven such metrics.
Why Stock Market Metrics Are Relevant To Every Investor
There are many factors influencing the performance of stocks: news, sentiments, global developments, or mere speculations. Metrics strip away all that clutter and present numbers out of companies’ financial statements which are comparable.
Using good stock market metrics, you will be able to:
• Distinguish between the great and mediocre companies on the basis of profitabilit and efficiency.
• Prevent overspending by verifying whether the valuation is reasonable.
• Notice warning signs like excessive debt or falling profits.
• Make comparison between companies operating in the same industry fairly.
• Feel comfortable not to panic in case of falling markets.
All the numbers together form the core of stock market analysis which means the study of the company and the market in order to determine the stock’s true value.
Understanding the Basics: Technical vs. Fundamental Analysis

Before delving into the numbers, it will be useful to understand their context.
There are two major ways of analyzing the stock market:
• Technical analysis uses price charts, patterns, and volumes to forecast short-term movement.
• Fundamental analysis uses financial data, earnings, management, and industry status of a company to determine its intrinsic value.
The basic question addressed by fundamental analysis is: “What is the intrinsic value of this business, and am I paying a good price for it?” All seven indicators listed below are based on fundamental analysis. This is your starting point if you intend to hold stocks for a few months or years.
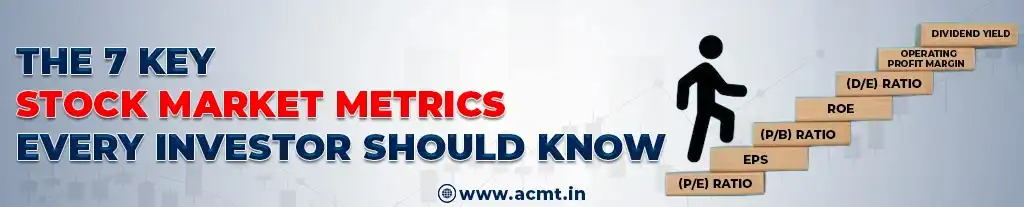
The 7 Key Stock Market Metrics Every Investor Should Know
1. Price-to-Earnings (P/E) Ratio: Are You Paying Too Much?
Among the various market indicators, the P/E ratio is one that you will hear about most frequently in business news and investor forums. Essentially, it determines the value of the company’s earnings – how many rupees you need to shell out currently for each rupee of earnings.
So Now: P/E Ratio = Current Market Value Per Share ÷ Earnings Per Share (EPS)
What it means: If a stock is trading at ₹200 and earning ₹10 per share per annum, then the P/E ratio stands at 20. This essentially means that investors are prepared to shell out 20 times the earnings of the business. So, in simple terms, it indicates what the market thinks of the company.
Interpretation of the P/E:
P/E ratio is high: It reflects optimism on the part of investors regarding future growth or overvaluation of the stock due to a disconnect between its price and the underlying business.
P/E ratio is low: The stock might be undervalued.
Pro Insights: The P/E ratio on its own is nothing much. Compare it to the average P/E ratio for the industry of that company, and see what the same stock was valued at for the last five or ten years. A P/E ratio of 30 could mean a lot to a technology firm but too much to a utility firm.
2. Earnings Per Share (EPS): How Profit Comes Into Your Hands
EPS tells you how much profit per share the company has earned
Calculation: EPS = (Net Profit – Preferred Dividends) / Total Number of Shares
Why EPS is important:
• Upward EPS over many years means a developing and well-managed company.
• Drop or volatility in EPS is a sign of problems.
• EPS forms the basis of the P/E ratio.
What should you see:
• 5 to 10-year increasing trend in EPS.
• Some growth in EPS due to company operations, rather than share buy-backs.
Check basic and diluted EPS. Diluted EPS is a more prudent measure since it takes into account all potential shares that may be issued in the future.
3. Price-to-Book (P/B) Ratio: What Are You Really Buying?
This ratio tells you how the price of a stock relates to its book value, i.e., what the firm would be worth if all of its assets were sold and all of its liabilities were paid off.
Now, P/B Ratio = Market Price per Share ÷ Book Value per Share
What it means:
• P/B under 1: The stock is valued at less than its book value. That might be a good sign or a red flag.
• P/B far above 1: The stock commands a premium, usually because the company makes excellent returns on its investments or owns assets of great value that cannot be readily quantified.
It works best for: banks, financial institutions, and firms that are asset-intensive, such as manufacturing. It’s not very useful for firms that don’t own many assets, such as software firms.
4. Return On Equity (ROE): How Well Is Your Money Utilized by Management?
Return on Equity (ROE) shows how well a business can produce earnings based on shareholders’ equity. Long-term investors appreciate this metric for a sound reason.
Return On Equity (ROE) = (Net Profit / Shareholder’s Equity) * 100
Why it is important?
• It tells if management produces or squanders shareholders’ equity.
• A firm with high ROE may expand its business without seeking new funds frequently.
Guideline:
• Above 15%, kept over many years, is usually regarded as a good level.
Caution: ROE may be misleading due to excessive leverage. This is why the following metric is critical.
5. Debt-to-Equity (D/E) Ratio: How Risky Is the Balance Sheet?
Though debt in itself is not always negative as strategic borrowings can lead to success, having too much debt can doom a firm in times of falling earnings or rising interest rates.
Debt to Equity (%) = (Total Debt / Shareholders’ Equity) × 100
Interpretation:
• Under 1: the firm has more equity than debt which means lower risks.
• Over 2: higher risks but the level acceptable for different industries varies.
Key considerations:
• Financing needs of banks, NBFCs, infrastructure companies are inherently high.
• Consider ROE in the context of peers and sector standards.
• Interest coverage ratio gives information about ability to service debts.
Firms that have low debt are more likely to survive recessions and thus, this is one of the best safety ratios in fundamental analysis.
6. Operating Profit Margin: Is the Business Actually Profitable?
While revenue may seem impressive, how much of that revenue do companies make once they pay their operational expenses? The answer lies in their operating profit margin.
Operating Margin = (Operating Profits ÷ Revenue) × 100
Why is it important?
• An increasing operating margin indicates a company has pricing power or good cost control.
• Maintained or increased margins point to an enduring competitive advantage.
• Diminishing operating margins can be early signs of increasing competition or costs.
How to use it:
• Analyze 5-year trends in operating margins.
• Calculate margins for your competitors and compare.
For instance, if Company A has an operating margin of 25% while its peers only have a 12%, then why?
7. Dividend Yield: Being Paid for Waiting
A dividend can be termed as payment by a corporation to its investors based on the profit earned. The dividend yield enables an investor to evaluate the dividend income received based on the current price of the stock.
Dividend Yield (%) = (Dividend Payment Per Share / Current Price of Stock) × 100
Things to look out for:
• A consistent and growing dividend is normally an indicator of strong finances and a shareholder-friendly management.
• It’s advisable to look into a dividend yield if it is unusually high. It might be due to crash in price, or the yield is unsustainable.
After calculating the Dividend Payout Ratio = Dividends Paid / Net Profit. This ratio between 30% to 60% is healthy since the business still has funds for growth.
All good businesses do not pay dividends. Young businesses usually re-invest all profits. Use this ratio to align your investment with your goals.
Quick Reference: The 7 Metrics at a Glance
| Metrics | What It Measures | Good Sign |
| P/E Ratio | Valuation | Reasonable vs. industry and history |
| EPS | Earnings Per Share | Consistent growth over time |
| P/B Ratio | Price vs. asset value | Reasonable in relation to returns |
| ROE | Management efficiency | Over 15% continuously |
| D/E Ratio | Financial risk | Low or industry-appropriate |
| Operating Margin | Core profitability | Increasing or stable |
| Dividend Yield | Income yield | Growing and sustainable |
How to Effectively Use These Stock Market Metrics

There is no magic number here. The key is to know how to combine these indicators.
Let me give you this easy 5-point checklist:
1. Always start with quality metrics: ROE, EPS growth, operating margin.
2. Then consider safety metrics: D/E ratio, interest coverage.
3. See if the company is valued properly: compare P/E and P/B with its competitors in the same industry.
4. Think about income metrics: look at the dividend yield and the payout ratio.
5. See what’s going on the long run: always check 5 to 10 years of history.
Example:
Let’s say that we have a company with a P/E of 18 (industry average 25), ROE 20%, D/E 0.3 and rising margins. This is an excellent combination – quality company undervalued and without risks. Another case is when there is a low P/E but EPS declining and debt growing. Then it’s probably a cheap stock for some reason.
Investor Errors with Stock Market Metrics

No matter how experienced you are, mistakes can still happen. So that not to make these typical mistakes of judgment:
• Focusing on only one ratio. Low P/E ratio does not necessarily mean that stock is a bargain.
• Not to consider the industry. In different industries, a ratio can be high or low.
• Concentrating on the most recent data. Pattern of ratios during a number of years will be a more informative guide than a single year.
• Missing important business factors. Many ratios say little about the value of the intangible assets of the company such as its excellent workforce or a strong brand name.
• Giving in to the pressure of market psychology. Ratios give investors another way to judge a stock instead of just going with the market trend.
Sources of Information for These Figures
One does not have to purchase expensive research software for finding the required figures for analysing a stock.
Sources include:
Financial statements and quarterly statements for information Official websites of NSE and BSE for market and company-related figures.
Stock screeners that are free and financial websites for comparison of ratios and other figures.
Before using a particular figure in your analysis, just pause and check the source of the number. Reverting to the original company documents helps to gain a better understanding of the figures.
Conclusion:
Successful investing is basically about knowing what you are getting and not being rash in making investment decisions. The seven measures of stock market valuation mentioned in this book (P/E ratio, EPS, P/B ratio, ROE, D/E ratio, operating margins, and dividend yield) provide you with a powerful toolset to start off in fundamental analysis.
Start simple. Choose one company you are familiar with and evaluate these seven measures. Compare the values obtained to those of two competing companies. You’ll get to know more about this company in an hour than the people owning the shares of this company.
Do not go out searching for the “perfect” stock. Look into the company properly, buy at a sensible price, and let the investment take its own time.
About The Author:
Arun Gupta is an educationalist in the stock market and trader with a focus on technical analysis, trading techniques, market behavior, and real market education. He tries to simplify the difficult trading concepts to make them easy to learn by both novices and experienced traders.The fields of interests of Arun Gupta are technical analysis, intraday trading, options trading, demand & supply analysis, and trading view based tools. In case you want to know more about his stock market education, market insights, and other useful information, then you can visit the official website of ACMT or you can follow him on Instagram.
