

10 Popular Technical Indicators: A Beginner Guide to Trading
Technical indicators assist traders to analyze price movements in a systematic manner. Depending on the indicator used, it may help one analyze trends, momentum, volatility, and trading activity.
Choosing an indicator for a beginner may be difficult since there is an array of technical indicators to choose from. This guide explores 10 popular technical indicators, namely RSI, Bollinger Bands, Fibonacci Retracement, Moving Average, MACD, VWAP, SuperTrend, Volume, SMA, and ACMT Infinity Extended 1.0. Beginners may find the wide range of indicators provided by various trading charting software as overwhelming. This guide explores 10 popular technical indicators, their classification, workings, application, strengths, weaknesses, and usage tips for beginners.
What Are Technical Indicators?
Technical indicators are mathematical computations that are largely dependent on market data, which may be price data, volume data, or both. These computations convert the raw data from the market into a visual signal or measurement that assists in the analysis of market behavior.
Technical indicators assist in answering questions such as:
• Is there a market trend?
• Are momentum and/or volatility increasing or decreasing?
• Are there key price levels in the market?
• Are there any changes in trading volume?
The key thing to understand about technical indicators is that they should facilitate analysis but not substitute for it.
Types of Technical Indicators
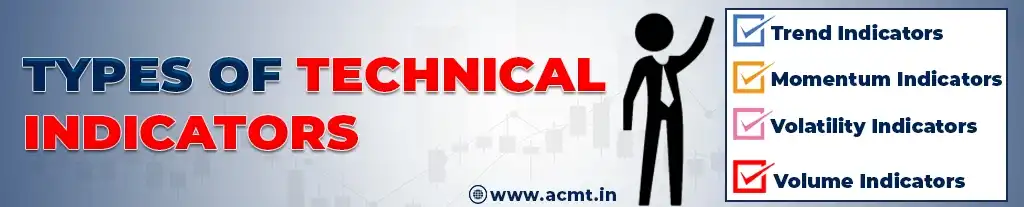
The technical indicators may broadly be classified into four types.
1. Trend Indicators
Trend indicators assist in understanding the overall direction of price.
They include:
• Moving Average
• SMA
• SuperTrend
2. Momentum Indicators
Momentum indicators are used to gauge the strength or speed of price movement.
They include:
• RSI
• MACD
3. Volatility Indicators
Volatility indicators assist traders in gauging how volatile prices are.
They include:
• Bollinger Bands
• ATR based indicators
4. Volume Indicators
Volume based indicators study the trading activity and may serve as an additional confirmation for price movement.
They include:
- Volume
- VWAP
Some indicators may fall under multiple categories, depending on their usage
Popular Technical Indicators Every Beginner Should Know
Here we shall look at 10 commonly used technical indicators and learn about their use and characteristics.
1. Relative Strength Index (RSI) –
Type: Momentum Indicator
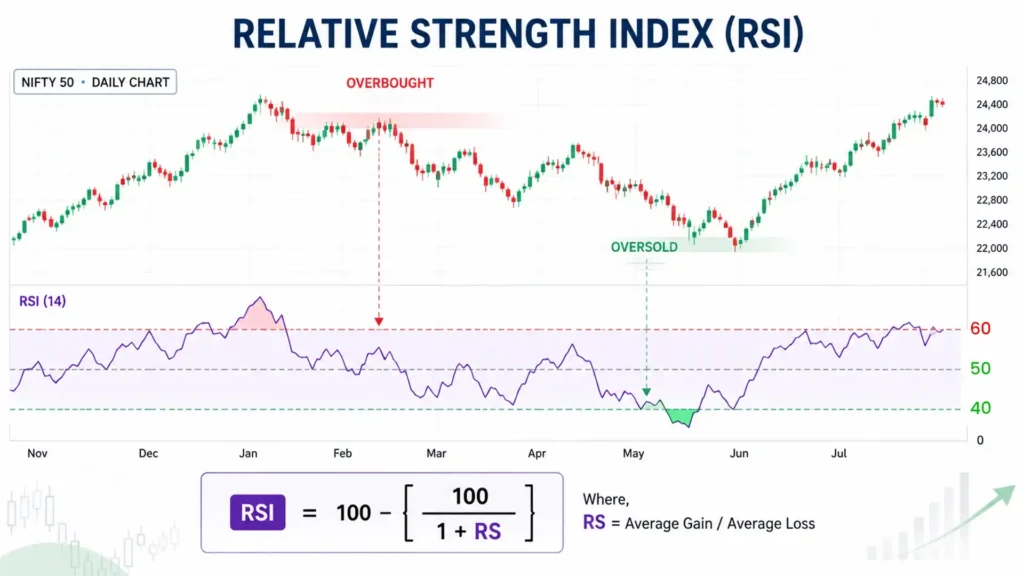
The Relative Strength Index (RSI) assesses the strength of recent trends and can be presented on a scale from 0 to 100.
According to the usual interpretation of the RSI indicator, the following should be considered:
• Over 60 – potentially overbought conditions
• Under 40 – potentially oversold conditions
• Around 50 – can serve as a momentum benchmark
The most commonly used formula for RSI is:
RSI = 100 − [100 / (1 + RS)]
where RS stands for the average gain in relation to the average loss over the chosen period.
Usage of RSI by traders :
RSI can be used for:
• Researching momentum
• Detection of potential overbought or oversold conditions
• Detection of momentum divergence
• Momentum comparison in different market phases
A crucial aspect about this tool is that overbought market does not mean price drop and the same about the oversold market and price rise.
2. Bollinger Bands –
Type: Volatility Indicator
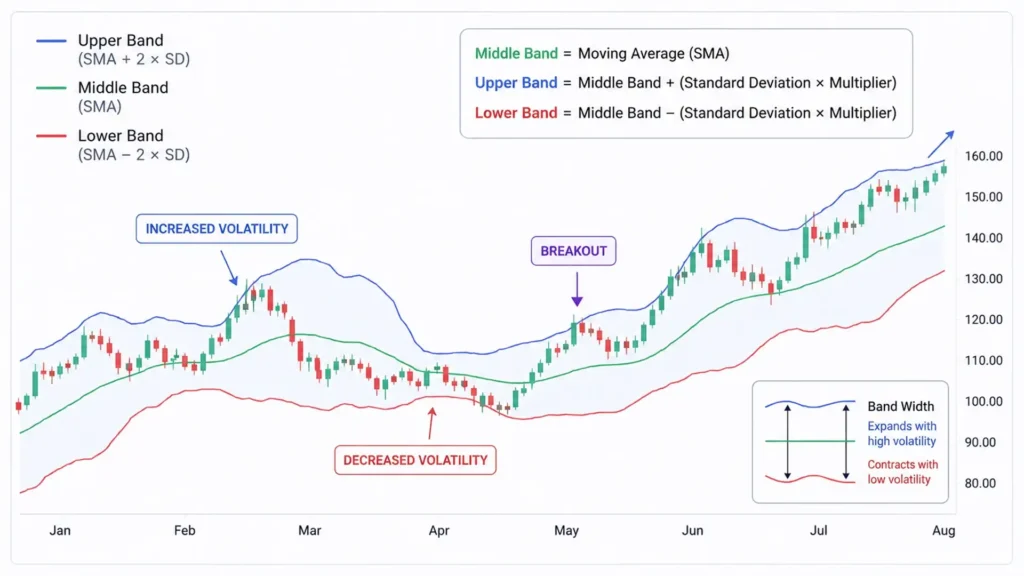
Bollinger Bands comprise a moving average with two bands above and below it based on the standard deviation.
The structure is as follows:
Middle Band = Moving Average
Upper Band = Middle Band + (Standard Deviation × Multiplier)
Lower Band = Middle Band − (Standard Deviation × Multiplier)
The width between the bands varies depending on market volatility.
Applications:
Investors apply Bollinger Bands for analyzing:
• Volatility increase and decrease
• The price behavior relative to the average
• Breakout signals
• Ranges in the market
A common misconception is the belief that when prices touch the upper band it signifies “sell” and when the prices touch the lower band it is “buy.” Prices can be near the band in case of a powerful trend.
3. Fibonacci Retracement –
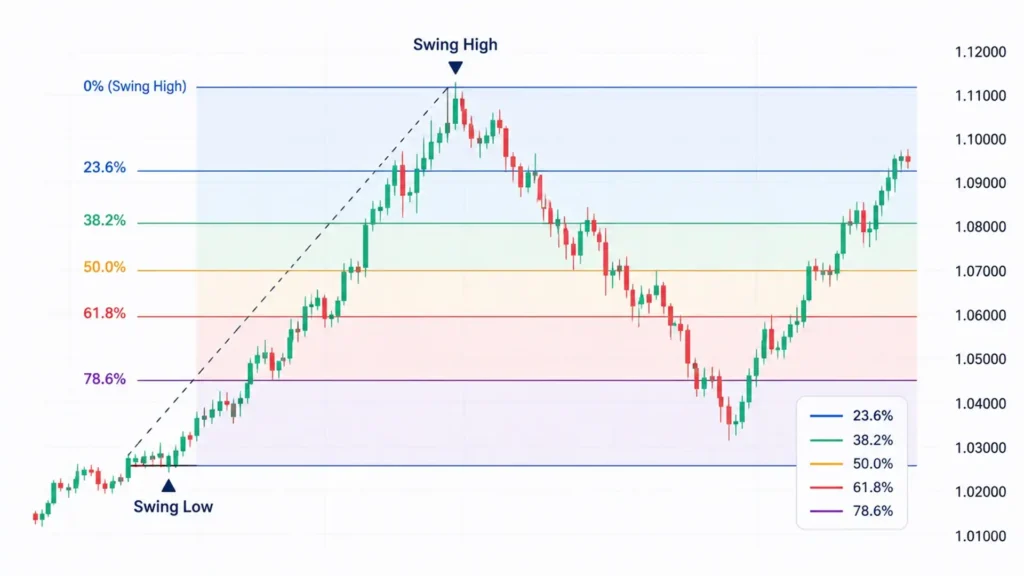
Type: Price-Level / Technical Analysis Tool
The Fibonacci Retracement tool is used to calculate possible retracement points after a price action has been made.
Typical retracement points are:
• 23.6%
• 38.2%
• 50%
• 61.8%
• 78.6%
Typically, Fibonacci retracements are applied on a level between a swing high and a swing low.
How to use it
A Fibonacci retracement can be helpful for traders by:
• Locating potential support and resistance levels
• Planning future entry points
• Learning about the depth of the retracement
• Locating target points
4. Moving Average –
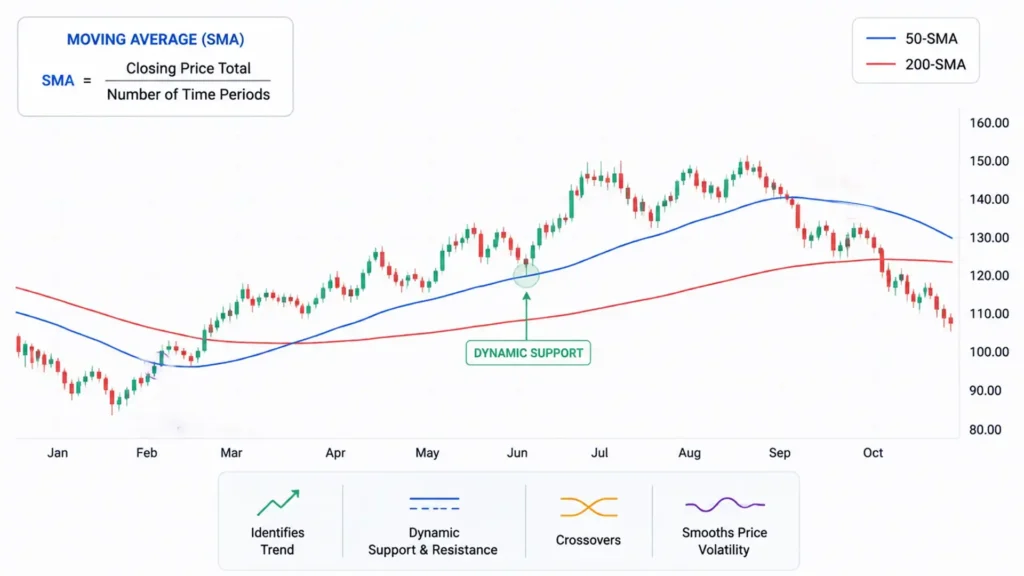
Type: Trend Indicator
Moving Average is a technique that involves smoothing out the prices for a chosen time frame to highlight the trend.
Among the most basic types of Moving Averages is Simple Moving Average:
SMA = Closing Price Total/Number of Time periods
Some of the uses of Moving Averages include:
• Identification of the trend
• Dynamic support and resistance
• Crossovers
• Smoothing of short-term price volatility
Shorter moving averages tend to be more responsive to price changes than longer ones.
5. MACD –
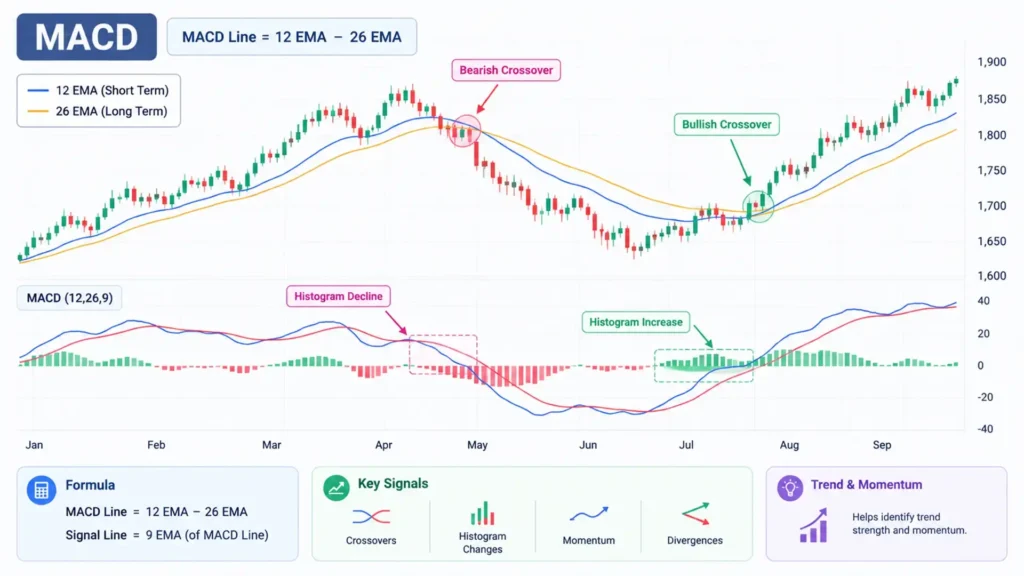
Type: Momentum & Trend Indicator
Moving Average Convergence Divergence (MACD) measures the difference between two exponential moving averages to determine the momentum and trends.
The formula used is as follows:
MACD Line = Short term EMA − Long term EMA
Signal Line for MACD is computed based on the values of the MACD Line.
The following are some of the indicators which traders often observe in relation to MACD:
• Crossovers of MACD and Signal Line
• Histogram Changes
• Changes in Momentum
• Divergences
6. VWAP –
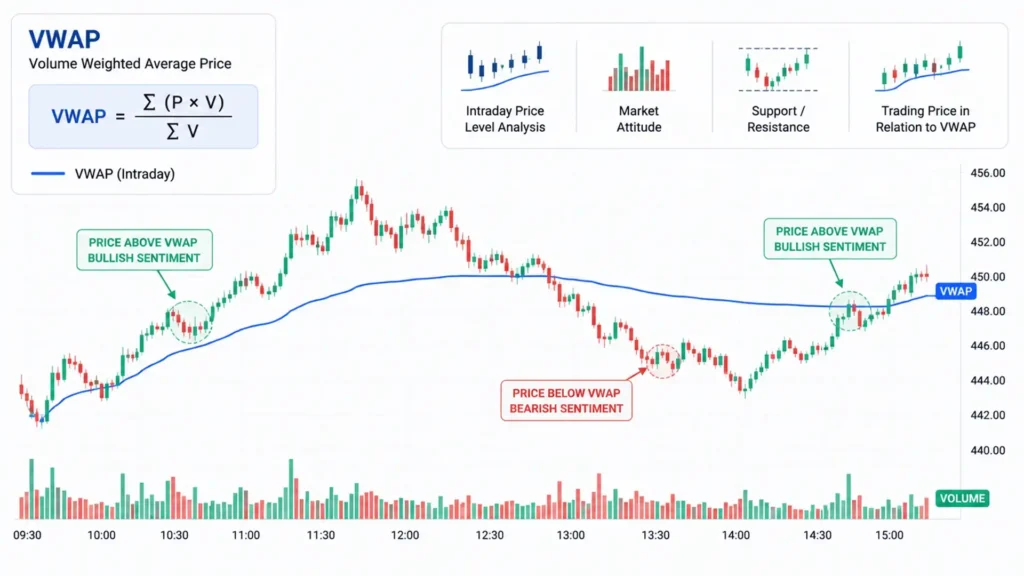
Type: Volume-Based Indicator
VWAP, which is Volume Weighted Average Price, uses both the price and the volume in calculating the average price level at which there has been trading in a particular trading period.
Its calculation formula is:
VWAP = Σ(P×V) ÷ ΣV
VWAP is quite common amongst the intraday traders.
Uses:
It helps in:
• Intraday price level analysis
• Market attitude
• Support/resistance levels
• Trading price levels in relation to the average price in the trading period
It is of great significance to traders using price and volume in combination.
7. SuperTrend –
Type: Trend Indicator
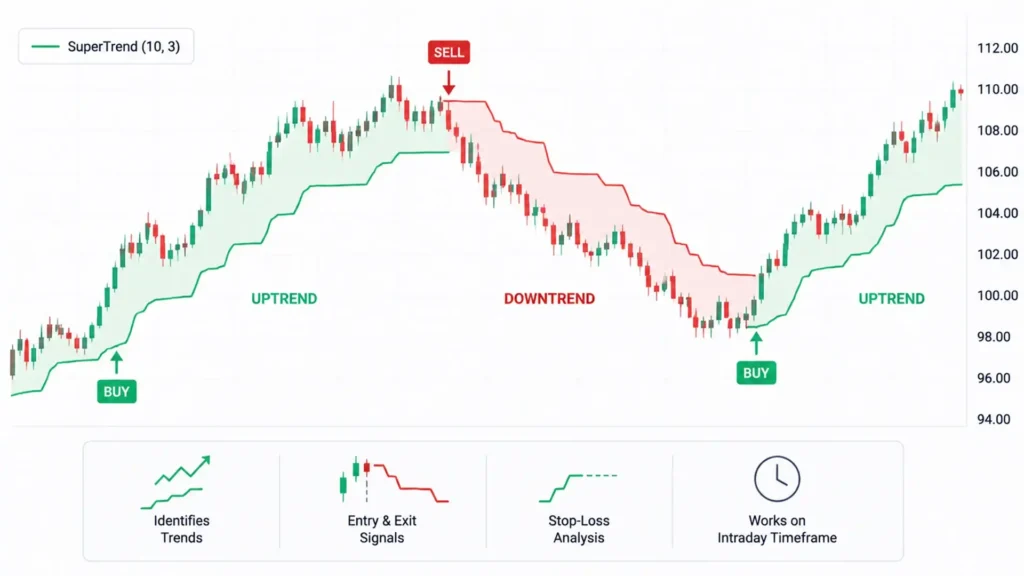
SuperTrend is a technical indicator that follows trends in order to give traders an idea of the general trend direction and trend change opportunities.
The indicator is usually composed of price, volatility and ATR-related computations to form a line around price.
SuperTrend is widely used for:
• Identifying trends
• Identifying entry and exit opportunities
• Stop-loss analysis
• Trend trading on intra-day timeframe
As any trend-following indicator, SuperTrend may behave differently under trending and ranging markets.
8. Volume –
Type: Volume Indicator
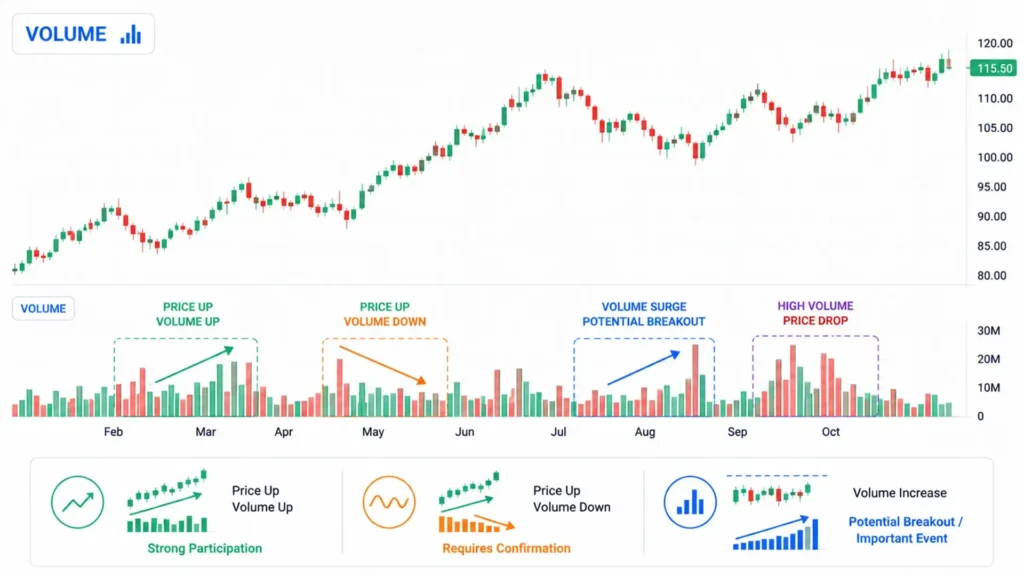
The volume is one of the easiest yet the most informative indicators that can be used in trading.
This is the total amount of trading that is done within a certain period.
Volume is normally compared to the price action so as to determine if there is strong or weak participation in a certain movement. For instance:
• Growing price + growing volume suggests strong participation.
• Growing price + falling volume requires confirmation.
• Volume increase signals a potential breakout or important market event.
9. SMA –
Type: Trend Indicator
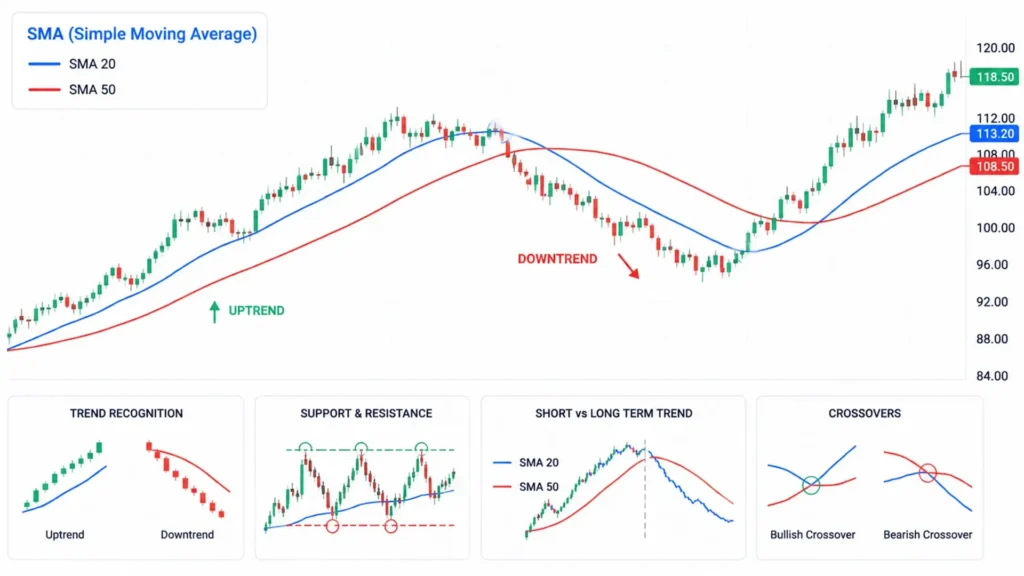
SMA (Simple Moving Average) is one of the most popular technical indicators.
The method computes the simple arithmetic mean of the closing prices of a certain period.
For instance, when computing the 20-period SMA, the sum of the closing prices of the past 20 periods is divided by 20.
Uses of SMA include:
• Trend recognition
• Support and resistance identification
• Determination of the difference between short and long-term trends
• Crossovers
However, since SMA assigns the same weight to every price chosen, it may take longer than other moving average calculations to respond.
10. ACMT INFINITY EXTENDED 1.0 –
Type: Multi-Timeframe Demand & Supply Indicator**
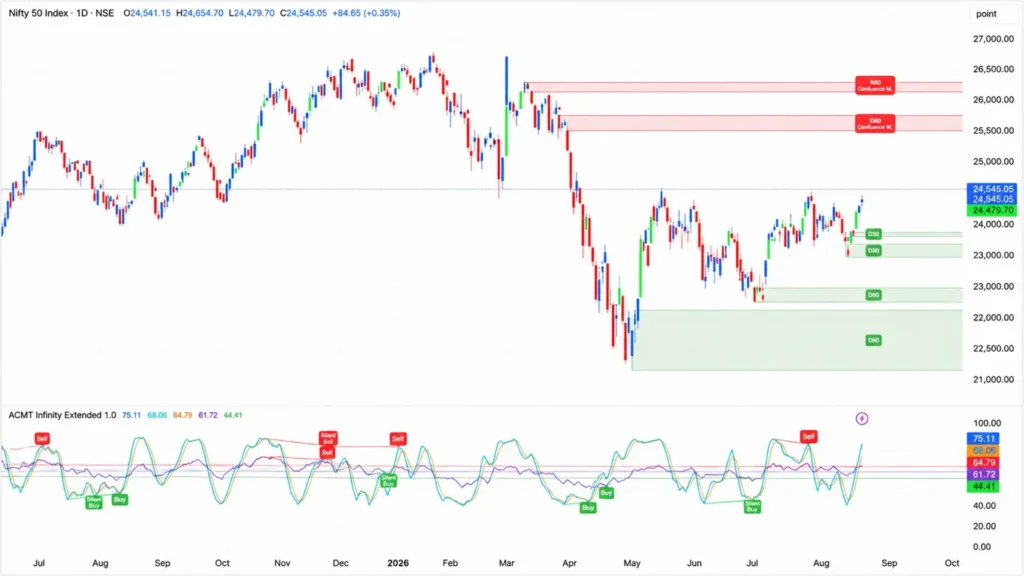
The ACMT Infinity Extended 1.0 trading indicator is created based on another type of technical analysis which consists in automated identification of demand and supply zones on various time frames.
Unlike momentum and trend analysis, the demand and supply analysis tries to detect regions on the chart where there has previously been considerable interest for buying and selling assets.
Its multiframes nature makes it possible for traders to analyze the demand and supply zones in various ways instead of just one time frame.
Uses of the ACMT Infinity Extended 1.0 indicator :
• Automated detection of demand and supply zones
• Analysis on various time frames
• Detection of important price levels
• Helping traders plan entries and exits
• Conjunction of zone analysis and market structure analysis
For those traders who need a demand and supply indicator on TradingView, ACMT Infinity Extended 1.0 becomes an alternative way of momentum and trend indicators. You can find more information about the ACMT Infinity Extended 1.0 TradingView Indicator at the official ACMT website.
How Do Technical Indicators Work?
The majority of technical indicators use historical data of the market and apply some mathematical calculation to it.
The inputs could be:
• Opening price
• Price high
• Price low
• Closing price
• Volume
• Time
And the calculation will give out information which can be presented visually on a chart.
For instance, the moving average takes into account past prices for presenting price trend more smoothly, while the RSI is used to process wins and losses for presenting momentum and so forth.
Thus, the technical indicators could be regarded as just different calculations of market data.
How to Utilize Technical Indicators Properly
Utilization of all ten indicators at once is rarely required. A novice trader should begin with some combination of indicators that perform different tasks.
One such practical combination may be:
Trend -> Momentum -> Price Zone -> Volume
For instance:
1. Use Moving Average or SuperTrend for analysis of trend.
2. Use RSI or MACD for analysis of momentum.
3. Apply Fibonacci zones or demand-supply zones for price reaction evaluation.
4. Utilize Volume or VWAP for extra information about market participation.
The idea is not to make indicators say the same thing. The idea is to develop a proper logic of analysis.
Advantages of Technical Indicators
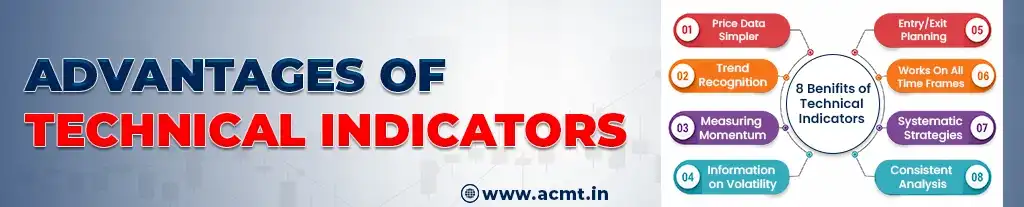
There are many advantages that technical indicators can offer including:
• Making complicated price data simpler
• Easier recognition of trends
• Aiding in measuring momentum
• Offering information on volatility
• Support for entry/exit planning
• Application on all sorts of time frames
• Supporting systematic trading strategies
• Aiding traders in maintaining a consistent analysis method
Limitations of Technical Indicators
Indicators also have important limitations.
They are based on historical data
Technical indicators mostly use information from the past. They cannot predict the future price movements.
There is always some delay in the signals
Trend indicators mostly give signals after the move has occurred.
Sideways movements may lead to false signals
Trend following indicators may give multiple signals when prices trade within a very narrow range.
Markets act differently
An indicator may need different settings depending on the asset, timeframe, and market conditions.
Too many indicators are confusing
Several indicators measuring similar features can lead to duplicity. Thus, it is advised to use technical indicators along with price action, market structure, and trade planning.
Which Technical Indicator Is Perfect for Beginners?
There is no such indicator that would suit all traders.
A beginner who wants to analyze the trends can opt for Moving Average or SuperTrend. A person looking at momentum indicators can try RSI and MACD. Those studying volatility can use Bollinger Bands, while those researching price zones can use Fibonacci Retracement and Supply-Demand indicators.
Intraday traders may also benefit from VWAP and Volume.
The optimal way is to learn one indicator at a time, knowing how it calculates and what its limitations are.
About the Author
Arun Gupta is an educationalist in the stock market and trader with a focus on technical analysis, trading techniques, market behavior, and real market education. He tries to simplify the difficult trading concepts to make them easy to learn by both novices and experienced traders.
The fields of interests of Arun Gupta are technical analysis, intraday trading, options trading, demand & supply analysis, and trading view based tools. In case you want to know more about his stock market education, market insights, and other useful information, then you can visit the official website of ACMT or you can follow him on Instagram.
Conclusion
Technical indicators could help organize market analysis, although technical indicators should never be considered a guarantee of profits.
RSI and MACD could be used for momentum analysis, Moving Average and SuperTrend could help with analyzing trends, Bollinger Bands would be used to determine the level of volatility, Fibonacci Retracement could be useful for retracement analysis, and VWAP and Volume could bring the trading volume into the picture.
Traders who focus on demand and supply analysis could use ACMT Infinity that could perform demand and supply zone identification automatically across multiple timeframes. The most valuable skill would be not an ability to use dozens of indicators but rather knowledge of their meaning, application and limitations.
