
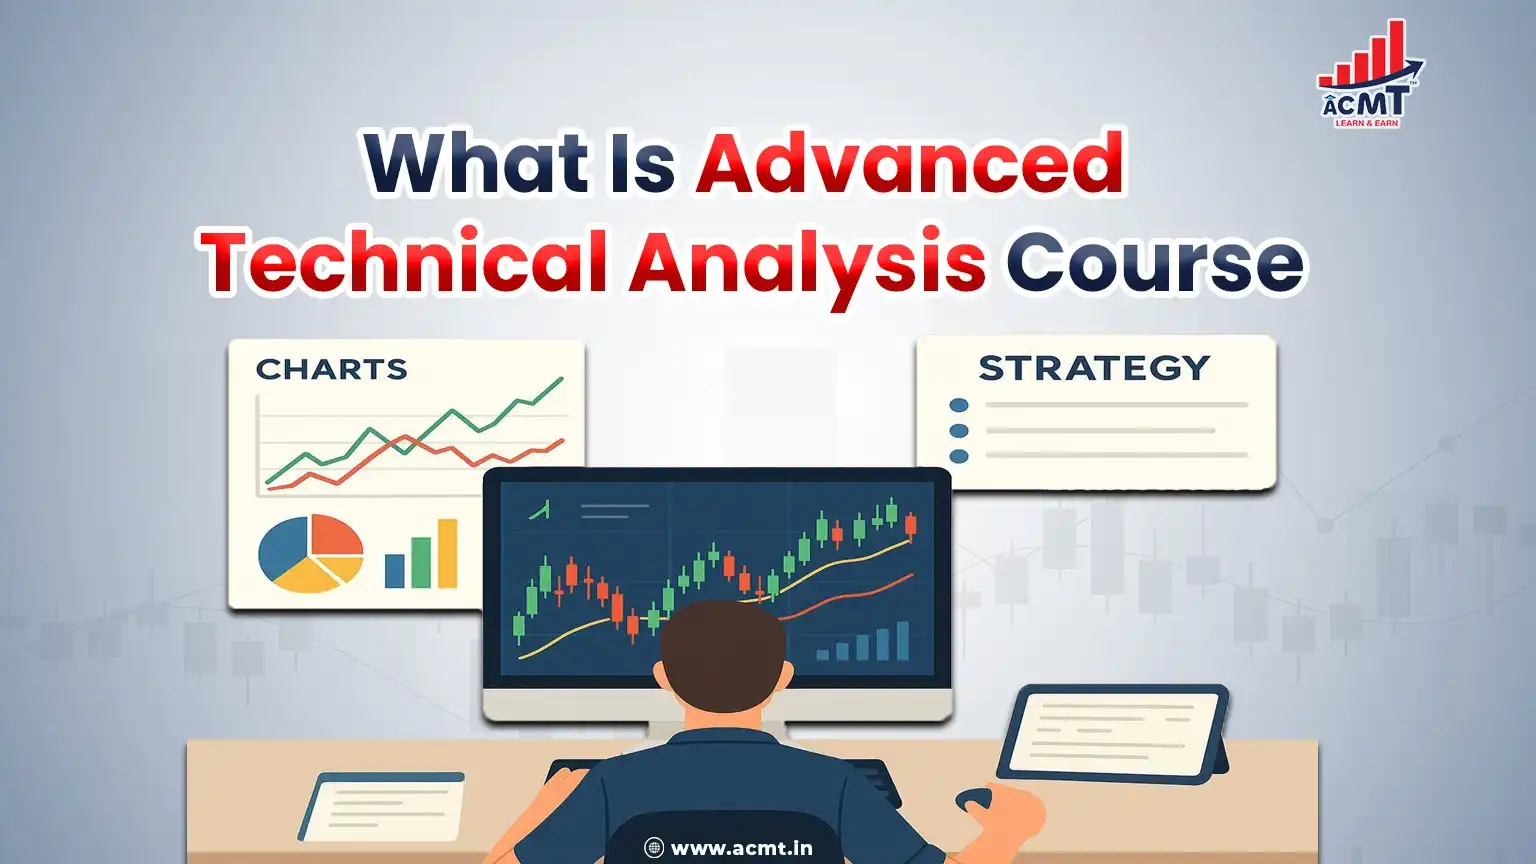
What Is Advanced Technical Analysis Course
Investment decisions are made using various tools, including Advanced Technical Analysis. The method involves predicting stock movements using data, such as pricing and trading volumes, over a fixed period.
Get an Advanced technical analysis certificate course from ACMT to know more.
Technical analysis examines statistics generated by market activity, including price and volume, and traders use these to predict stock movement. While the security’s intrinsic value is not taken into account, an attempt is made to examine patterned indicators that predict the stock’s future performance. This is an extremely popular method compared to conventional analysis, which compares fiscal data from previous years to determine future stock growth. Technical analysis holds that securities exhibit predictable trends, which continue until an event alters the trend. Up until then, the theory maintains that the securities’ price levels are predictable. There have been several instances of successful trading by investors simply using the chart, without even knowing what the actual company does. A fantastic tool, technical analysis is sometimes highly effective when used alongside other fundamental analytical methods.
Learn everything about technical analysis in ACMT’s Advanced Technical Analysis Course For Stock Market. Here is a glimpse of the modules you get to learn.
How Does Technical Analysis Work?
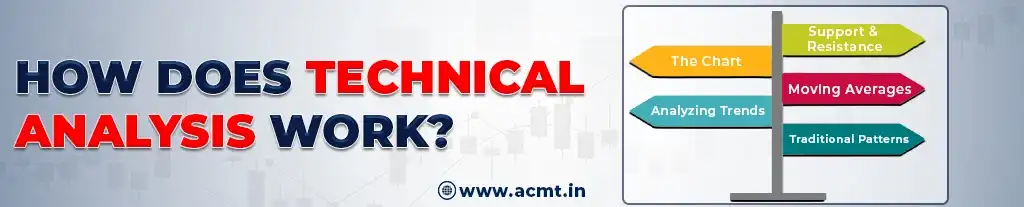
Historical price movements and trading volumes are keenly observed through a chart that is all about numbers. It involves reading the market’s mood through indicators and identifying trends that influence buying and selling decisions based on price movements. The company’s fundamentals do not play a role in the decision-making process. Security volumes and price fluctuations over time are examined, and no single indicator can provide a precise picture. It is only a cluster of price points, the time frame and the volume of stock at that particular point that help the investor determine the future price.
List of Indicators
The Chart
A very popular and prevalent methodology, chart analysis helps predict the existing trend of a stock. Various charts with different metrics may be used because each conveys different information. Informed decisions are made as asset prices and trading volume are visually represented across different periods. Either a Candlestick or Bar Chart may be used for the analysis.
Essential Tip: Volume is significant in chart analysis and valuable for bullish and bearish signals.
Widely used, the candlestick chart shows price changes during the day (also the day chart) and graph changes over a four-hour period.
Analyzing Trends
Ever heard of ‘the trend is your friend’? This is extremely common in the financial and stock-trading industries. The concept primarily states that the momentum of a security will move in the same direction, and you shouldn’t contest it. Before making an investment, define the stock’s trend to ensure investment in the direction of that trend. When it moves up, it is highly probable that it will continue that movement. The upward trend line is considered a positive movement where two or more ascending troughs are connected on a price curve. This means that demand is stronger than supply. The trend remains valid as long as it remains above the trend line. The downward trend line is considered negative when two or more descending vertices are connected on the price curve. This means supply exceeds demand. The trend, therefore, remains valid as long as the stock is visualized below the line. A bullish signal is sent when the price breaks through the trend line, indicating an increase in demand.
Support and Resistance
When an asset price rebounds, going up or down, you can see points of support and resistance levels. If the trend is downward, it will reach a lower price level that is attractive to buyers. Prices start rising and demand increases. This rebound point, over time, can be plotted in a straight line, which is called the support level.
When an asset’s value increases, it comes to a point where demand outdoes supply. Traders may think the prices are too high when they increase and the stock has already met a perceived price; from here, it is overvalued. Demand from here decreases, and the asset’s value declines.
These price levels are used by investors to set their purchase and sale prices. Thus, support and resistance lines are used in technical analysis to predict price thresholds.
Moving Averages
You can predict a security’s average value over a fixed time frame by using the moving averages indicator. You add up the closing value at each time frame and divide it by the total number of time frames. Traders can establish support and resistance zones with the moving averages trend indicators for a particular stock. The buy or sell signal is considered when the share price crosses a moving average, as this indicates a shift in the stock’s directional momentum. Time frames for moving averages may range from 20 to 50 and 200 days (typically for long-term investors).
Traditional Patterns
Traditional or Classic patterns are typically those that have a long bullish or bearish horizon. They come with distinct price shifts and patterns. Some of them are a blend of support and resistance levels and trendlines. Classic patterns provide investors with a target price; a popular pattern that traders look for is the bullish head-and-shoulders pattern.
ADVANCED TECHNICAL ANALYSIS ONLINE COURSE
When you join ACMT, you get to learn from the best in the industry. Make the most of hands-on knowledge and practical Advanced Technical Analysis Online Course for stock market at our institute.
ABOUT MENTOR
Advanced Technical Analysis online course and all others trading courses are designed and delivered by Mr Arun Gupta, a seasoned trader based in Jaipur. A veteran trader and stock market guru, he has consistently offered students some of the best and most practical guidance they need, absolutely free.
Mr. Arun Gupta is a leading stock market trainer and trader who practices in Jaipur. For him, it’s not just about conventional trading. It is about applying proven methods alongside modern technology and prudence that makes a successful trader. He delves into the why, what, how, and when of stock trading using the best combination of historical analysis and practical investing. With decades of experience, expertise, and learning, Mr. Gupta today guides millions through the complexities of the stock market.
