Supply And Demand Trading Strategy Explained For Traders
There are several trading setups available, and choosing the one that suits you best is extremely important. Demand and supply is a unique and powerful approach that combines the laws of physics with market science, unlike other conventional trading methods. But what exactly is the demand-supply trading technique, and how can you trade with this concept to build wealth?
Highlights:
- Future reactions are anticipated or predicted with the help of supply and demand zones
- When active buying drives prices higher, demand zones rise; when prices fall, supply zones form.
- These are strong support and resistance levels, as well as potential entry, exit, and stop-loss points.
- Trending markets are best suited for supply-and-demand predictions.
- Accuracy improves with pairing tools like structure breaks, RSI, MACD, etc.
Overview – Supply and Demand Trading
Demand and supply exist everywhere. These are universal forces that influence costs across markets, and the same holds for stock trading. If demand is the willingness to buy, then supply is the willingness to sell. When prices rise, the momentum is bullish. This means demand exceeds supply. Alternatively, when supply exceeds demand, prices fall, and the momentum is bearish.
With these price shifts, we can identify trend reversals or continuations on a chart, which traders use as reference points for entry and exit strategies. In other words, these are denoted as demand and supply zones.
How do we gauge supply and demand?

Ever been on a seesaw? Supply and demand work similarly, with all factors affecting the stock price. If an economic event reduces supply for a stock and increases demand, place it on the left side of the seesaw; vice versa, if it decreases demand and increases supply, place it on the right side. Observe the number of factors placed on the left side. The seesaw seems to tilt upwards, and the value of the stock rises. Alternatively, when there are more factors on the right side and the seesaw tilts downwards, the value of the stock drops. When traders take these factors into account, they can assess a stock’s performance and profit from it.
Based on price action, which is also similar to support and resistance, supply-and-demand trading uses fundamental dynamics of availability and non-availability in conjunction with financial markets and the broader economy.
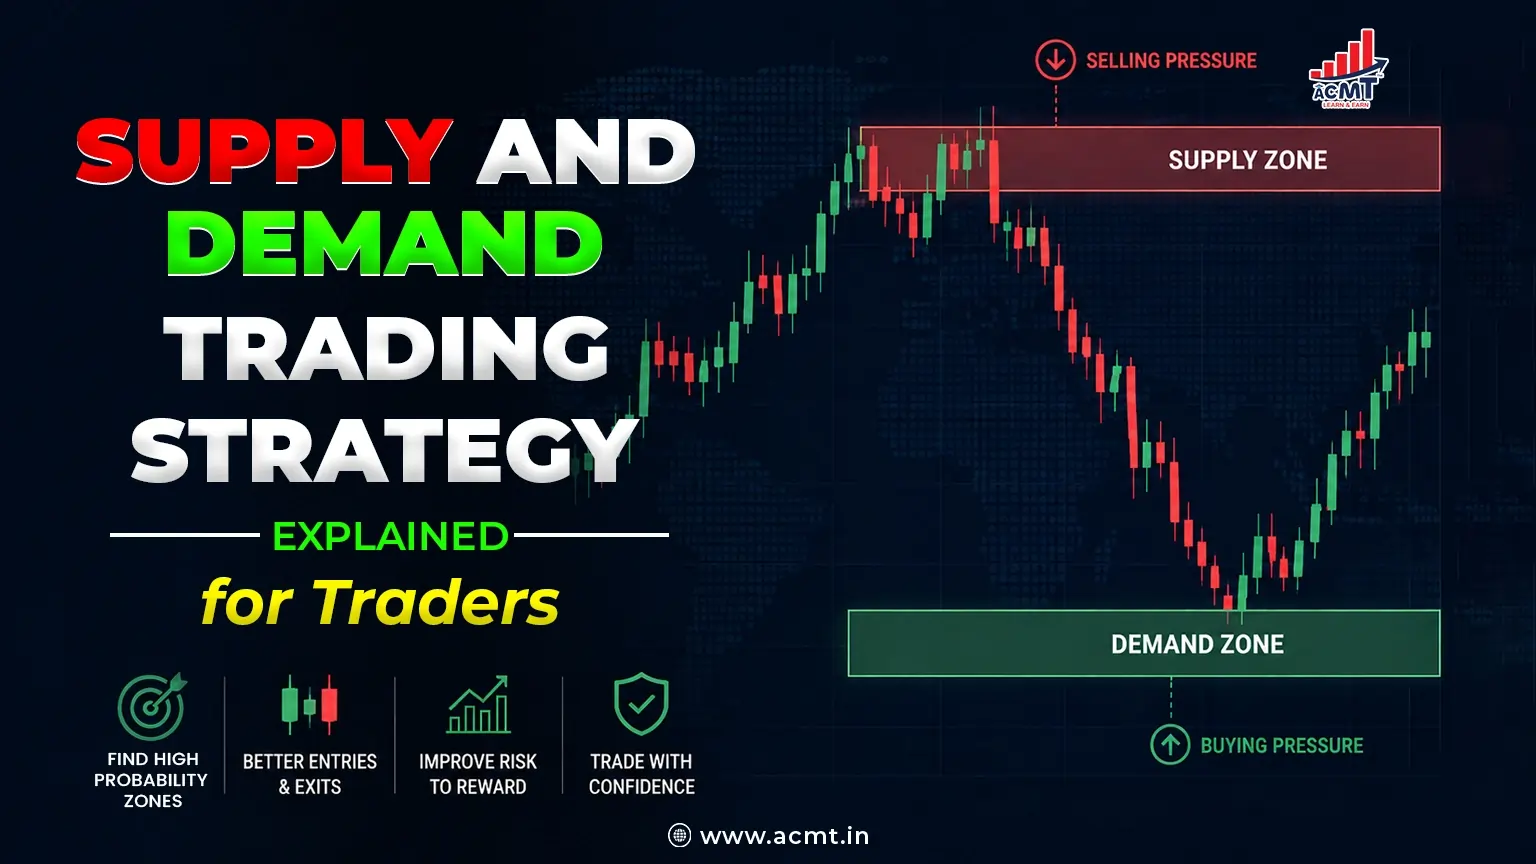
Trading in supply and demand zones
In supply-and-demand trading, specific chart areas are identified where institutional buyers and suppliers drive massive price fluctuations, then trade at those levels when prices retrace. This would involve identifying sharp or impulsive price action, drawing boxes around consolidation candles that appear earlier, and waiting for the price to return to the zone. Traders conduct a retest before entering a trade with a stop-loss. The zones are defined as high-probability areas where trends accelerate, reverse, or pause.
Example of Demand Zone:
A sudden increase in the price of a stock from ₹500 to ₹540 with good momentum can mean that the region of ₹500 to ₹505 becomes a demand zone.
Example of Supply Zone:
Suppose that the price of a share drops drastically from Rs. 1200 to Rs. 1120; then, the zone between Rs. 1190 and Rs. 1200 could be considered the supply zone.
Raw market intent from major participants becomes evident in supply and demand zones, which is why they are a powerful tool for identifying price action with absolute accuracy.
Thus, traders know how these zones emerge and identify them for use in trading strategies across various stocks, including crypto, forex, and commodities, as well as equities.
But how are they actually traded?
Specific areas on the price charts are marked where significant buying and selling activity has taken place. These spots are called supply and demand zones. With this, traders can manage risks, identify high-probability trades, and even anticipate potential price reversals.
Supply and demand zones can be traded in two ways.
Set-and-Forget approach – Place a limit order at the bottom of the supply zone or the top of the demand zone. Watch out for the price spiking quickly through the zone. Other than that, it gives the freedom to look away from the charts for a while.
Wait for the Initial Reaction – This second approach requires you to enter with a market order and then wait for the first reaction. Target the next supply and demand zone (or support and resistance zone) when the stop loss goes to the other side of the zone. Test what best suits your trading style, then enter the market – this entirely depends on the individual trader.
Key points
- Demand Zones – where price increases due to buying pressure
- Supply Zones: Selling pressure leads to price drops
- These are useful because they outperform conventional resistance and support levels, show a 68% success rate, reveal institutional activity, and aid accurate trade entries.
- You can spot the zones with volume spikes, price consolidations prior to reversals, and sharp price movements.
- Ideal timeframes are daily or weekly charts for major zones, and for refined entries, use 4-hr or 1-hr charts.
Types Of Supply And Demand Patterns

Rally Base Rally (RBR)
A bullish continuation pattern where:
- Price rallies
- Creates a small base
- Continues upward
This indicates strong demand.
Drop Base Drop (DBD)
A bearish continuation pattern where:
- Price drops
- Forms a base
- Continues downward
This indicates a strong supply.
Rally Base Drop (RBD)
A bearish reversal pattern.
Price moves upward, pauses, and then falls sharply.
This creates a supply zone.
Drop Base Rally (DBR)
A bullish reversal pattern.
Price falls, forms a base, and then rallies strongly.
This creates a demand zone.
Characteristics of Good Supply and Demand Zones
The time market stays outside the zone is important, and when it remains within a longer time frame, it carries more value. However, the market shouldn’t be shifting in and out of a zone either. It should be a nice, rounded retest in the zone. What exactly are the characteristics of good zones?
- When the departure is clean, strong zones move quickly and directionally away from the base
- Fewer candles carry informational weight and display compact bases and short consolidations
- Zones not revisited are more attractive than heavily tested ones, which are fresh levels
- Finally, across intraday and weekly timeframes, zones appear across all assets, including commodities, forex, and equities.
Spotting Supply and Demand Zones

Supply and demand zones are spotted depending on price behaviour before sharp breakdowns or expansions. Emphasis is placed on sequencing and context – how does the price leave an area?
Zone identification
- Impulsive moves are spotted. These are the areas where price accelerates quickly and strongly. There is no overlap between the candles.
- Focus is on locating the base. A pause or short consolidation is formed just before the move starts.
- Candle structure is evaluated in small wicks, narrow ranges, or compressed price action, often pointing to balance.
- The direction is assessed by whether the price exited downward or upward, creating supply and demand zones.
- Price behaviour when it returns to the area gives more information about the original move. This means the reaction quality is assessed.
- Identify or use multiple timeframes, with lower timeframes indicating precision and detail, and higher timeframes providing context.
- Filtering zones by environment, where zones near highs, lows, and structural shifts have more relevance than those in the mid-range area.
Bottom Line
Supply and demand zones drive the market, although support and resistance levels seem more popular. Indeed, supply and demand areas are the leading causes of support and resistance formation. For instance, when you see two stacked demand zones, they trigger consequent bullish bounces leading to the creation of a new support and resistance area. Zones can be identified effectively when you see high-impact price areas in advance.
The relative pattern of zones supports market analysis across asset types. The approach revolves around understanding context, precision, reactions, and managing invalidation without relying on certainty. Over time, the exposed zones may support consistent price-behaviour framing across markets.
ACMT teaches you to put this theory into practice and gives you access to a wide range of competitive trading options. With us, you get to learn from the best.
Smart Trading Tools Comparison Table –
| Feature | Structure Break | RSI | MACD |
|---|---|---|---|
| Full Form | Market Structure Break | Relative Strength Index | Moving Average Convergence Divergence |
| Type | Price Action Concept | Momentum Indicator | Trend + Momentum Indicator |
| Purpose | Detect trend reversal or continuation | Identify overbought & oversold zones | Identify trend direction & momentum |
| Based On | Price movement | Price strength/speed | Moving averages |
| Main Signal | Break of support/resistance | 30 & 70 levels | Line crossovers |
| Bullish Signal | Price breaks previous high | RSI moves above 30/50 | MACD crosses above Signal Line |
| Bearish Signal | Price breaks previous low | RSI falls below 70/50 | MACD crosses below Signal Line |
| Best Market Condition | Trending market | Sideways / reversal market | Strong trending market |
| Accuracy | High with confirmation | Good for reversals | Good for trend confirmation |
| Lagging/Leading | Slightly leading | Leading | Lagging |
| Timeframe Suitability | All timeframes | Intraday & Swing | Swing & Positional |
| Key Advantage | Clear market direction | Easy to identify momentum | Strong trend confirmation |
| Limitation | Fake breakouts possible | False signals in strong trends | Delayed entries sometimes |
| Used By | Price Action & SMC traders | Intraday & Swing traders | Trend-following traders |
| Best Combination | With RSI & MACD | With Structure & Volume | With Structure Break |
Conclusion
The Supply and Demand trading strategy helps traders identify key zones where institutions place major orders, improving trade accuracy and timing. By patiently waiting for price reactions at these levels and applying proper risk management, traders can increase consistency. When combined with market structure, trend direction, and confirmation signals, this approach becomes even more effective, helping traders avoid false entries and build disciplined trading habits for long-term success. With regular chart practice and proper trade planning, traders can better understand price behavior and confidently apply this strategy across intraday, swing, and positional trading opportunities in different market conditions.
About The Author
All courses are designed and delivered by Mr. Arun Gupta, a seasoned trader based in Jaipur. A veteran trader and stock market guru, he has consistently offered students some of the best and most practical guidance they need, absolutely free. Check out ACMT’s Instagram account to learn more about what you can learn from these easy-to-understand snippets.
Mr. Arun Gupta is a leading stock market trainer and trader who practices in Jaipur. For him, it’s not just about conventional trading. It is about applying proven methods alongside modern technology and prudence that makes a successful trader. He delves into the why, what, how, and when of stock trading using the best combination of historical analysis and practical investing. With decades of experience, expertise, and learning, Mr Gupta today guides millions through the complexities of the stock market.